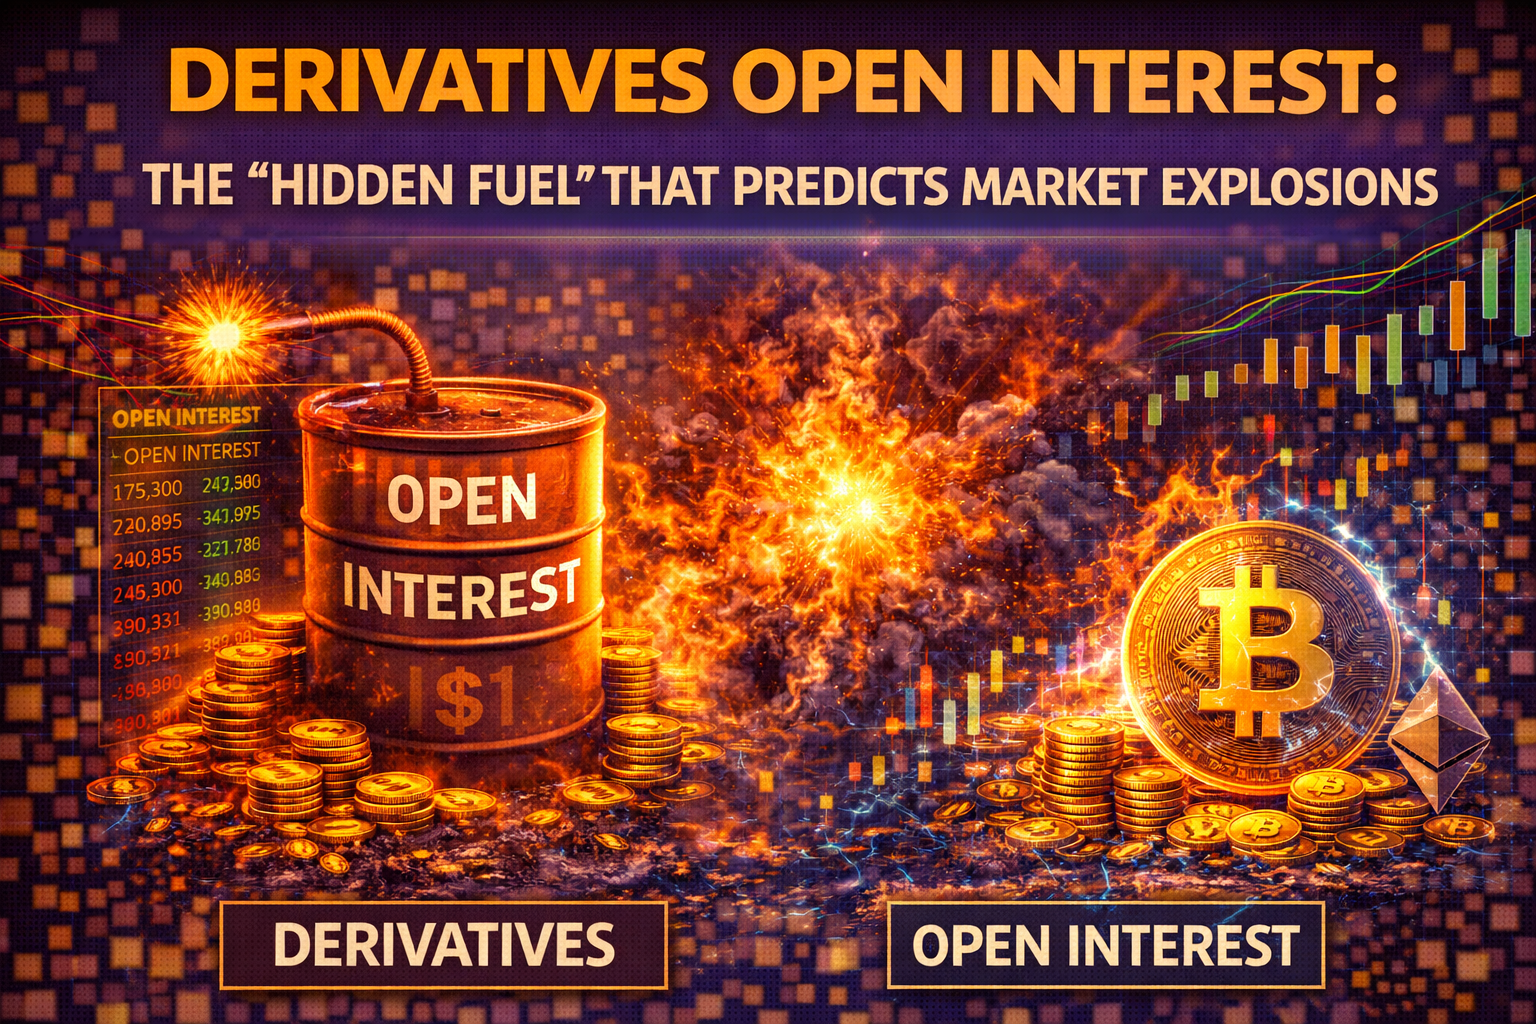
Price tells you where the market is, but derivatives open interest tells you where it’s going. Learn to use this hidden metric to predict volatility and spot massive squeezes before they happen.
Table of Contents
I learned the hard way that price is a liar.
Years ago, during a particularly boring week in the market, Bitcoin was crabbing sideways. The charts looked asleep. The RSI was flat. The news was quiet. I thought, “Great, time to take a weekend off.”
Two days later, the market nuked 15% in a single hour. I was liquidated, confused, and angry. How could a crash happen when the market looked so calm?
The answer wasn’t on the price chart. It was hidden in the derivatives open interest. While the price was flat, traders were quietly piling billions of dollars into leveraged positions behind the scenes. The market wasn’t “calm”; it was a coiled spring waiting to snap.
If you are only looking at price candles, you are trading with one eye closed. To survive in the modern financial markets—whether you trade crypto, commodities, or stocks—you need to understand the flow of leverage. You need to master derivatives open interest.
In this deep dive, we are going to strip away the Wall Street jargon. We’ll look at what derivatives open interest actually represents, how it differs from volume, and how you can use it to spot “short squeezes” and “long liquidations” before the rest of the market wakes up.
The Poker Analogy: What is Derivatives Open Interest?
To understand derivatives open interest, imagine a poker game.
- Volume is the number of hands played in an hour. It tells you how active the table is.
- Open Interest is the total amount of money sitting in the pot right now.
If the Volume is high, people are playing a lot. But if the derivatives open interest is high, it means there is a massive pile of chips on the table that someone is going to win—and someone is going to lose.
In technical terms, derivatives open interest represents the total number of outstanding contracts (futures or options) that have not been settled.
- If I go Long 1 BTC and you go Short 1 BTC, the derivatives open interest increases by 1.
- If I close my position, the derivatives open interest decreases by 1.
When derivatives open interest is rising, it means new money is entering the casino. When it’s falling, it means money is leaving. This simple metric is the best proxy we have for “market greed” and “market fear.”
Volume vs. Open Interest: The Crucial Distinction
Most new traders obsess over Volume. “Wow, look at that volume spike!” they say. But volume can be misleading. High volume often happens at the end of a move (capitulation).
Derivatives open interest, on the other hand, gives you the structure of the market.
- High Volume + Low OI: This is usually day traders flipping positions. It’s noise.
- Low Volume + Rising OI: This is the danger zone. This means positions are building up, but price isn’t moving yet. This is the “calm before the storm” I mentioned earlier.
Understanding the relationship between these two is the first step in reading correctly. Volume tells you the intensity of the current moment; Open Interest tells you the potential energy for the next move.
The Four States of the Market
You can predict price action by combining Price trends with derivatives interest trends. There are four distinct states you need to memorize.
1. Long Build-Up (Bullish)
- Price: Rising
- Derivatives Open Interest: Rising
- Analysis: This is a healthy bull market. New money is entering to buy. The trend is supported by real capital commitment.
2. Short Build-Up (Bearish)
- Price: Falling
- Derivatives Open Interest: Rising
- Analysis: This is aggressive shorting. Traders are betting heavily that the price will go lower. While bearish, be careful—if derivatives open interest gets too high here, a “Short Squeeze” becomes likely.
3. Long Liquidation (Bearish)
- Price: Falling
- Derivatives Open Interest: Falling
- Analysis: This isn’t new sellers entering; this is old buyers giving up. They are closing their longs (selling) to stop the pain. This is often called “Long Covering.”
4. Short Covering (Bullish)
- Price: Rising
- Derivatives Open Interest: Falling
- Analysis: This is the classic “Short Squeeze.” Price is going up because shorts are being forced to buy back their positions to exit. It’s explosive, but often short-lived because no new money is buying—just old money exiting.

The “Squeeze” Indicator: When the Rubber Band Snaps
The most profitable way to use derivatives interest is to predict volatility.
Think of the market like a rubber band. As derivatives open interest increases relative to the market cap, the rubber band stretches.
- If OI is low, the market is loose. It takes a lot of buying/selling to move price.
- If OI is historically high, the market is tight. A small move can trigger a cascade of liquidations.
The Setup: I look for periods where price is consolidating (moving sideways) but derivatives open interest is skyrocketing. This creates a divergence. The market is winding up. Traders are fighting over a tight range, adding leverage.
Eventually, price will break the range.
- If it breaks up, the massive pile of Shorts (represented by the high derivatives open interest) will get wrecked. They have to buy to cover, fueling a vertical rally.
- If it breaks down, the Longs get wrecked. They sell to cover, fueling a crash.
When you see derivatives open interest hitting multi-month highs, stop trading the range. Start preparing for the breakout. The volatility is guaranteed; the direction is the only variable.
Crypto vs. Traditional Markets: The Perpetual Nuance
If you are trading crypto, you have a unique beast to deal with: The Perpetual Future.
In traditional markets (commodities, stocks), futures contracts expire every month. This naturally resets the derivatives open interest. In crypto, “Perps” never expire. This means leverage can build up indefinitely until a violent market event clears it out.
This makes derivatives open interest even more powerful in crypto than in stocks. In 2021 and 2024, nearly every major Bitcoin crash was preceded by a massive spike in derivatives open interest. It became a crowded trade. Everyone was Long. When everyone is on the same side of the boat, the boat tips over.
How to Track It (Free Tools)
You don’t need a $24,000 Bloomberg terminal to see this data anymore.
- Coinglass (Crypto): The holy grail for crypto traders. It shows you the derivatives open interest across all major exchanges (Binance, Bybit, CME) in real-time.
- TradingView: You can now overlay Open Interest indicators on your standard charts for many assets.
- CME Group Website (Traditional): For S&P 500 or Gold futures, the CME publishes daily reports on derivatives open interest.
Pro Tip: Look at the “OI/Market Cap” ratio. If the derivatives open interest exceeds 3% or 4% of the asset’s total market cap, you are in the danger zone.
The Trap: Don’t Trade OI in Isolation
A word of warning: High derivatives open interest doesn’t mean a reversal is imminent immediately. It just means the fuel is there.
I have seen traders short a rally just because derivatives open interest was high, thinking “it has to squeeze.” But the market can stay irrational longer than you can stay solvent. High OI acts as fuel, but Price Action is the spark. You need the spark to ignite the fuel.
Wait for the market structure to break.
- If you see high OI and a Short Build-Up, wait for price to reclaim a key resistance level before betting on the squeeze.
- Don’t try to catch the falling knife just because derivatives open interest suggests Longs are washing out.
Conclusion: Trading the Invisible
Most people look at the waves on the surface of the ocean. Smart traders look at the currents underneath.
Derivatives open interest is that current. It tells you the commitment of the market participants. It tells you when a trend is backed by real conviction and when it is just a hollow “short squeeze” that will fade.
If you want to stop getting blindsided by sudden volatility, add derivatives open interest to your daily checklist. It won’t tell you exactly when the explosion will happen, but it will tell you exactly how much dynamite is sitting under the floorboards.
Do you check the Open Interest before entering a leverage trade, or do you fly blind? Let me know your routine in the comments.
CME Group: Understanding Open Interest Investopedia: Open Interest Definition and Strategy
Frequently Asked Questions (FAQ)
1. Does high derivatives open interest mean the price will go up? No. High derivatives open interest simply means there is a lot of leverage and activity in the market. It indicates that a big move (volatility) is coming, but it doesn’t specify the direction. It could result in a massive crash or a massive rally depending on who gets squeezed.
2. What is the difference between volume and derivatives open interest? Volume measures the number of contracts traded during a specific period (e.g., today). Derivatives open interest measures the total number of contracts that are still open and active. Volume resets every day; Open Interest carries over until positions are closed.
3. Why does derivatives open interest drop during a crash? This is known as a “flush.” When price crashes, traders who were Long are forced to sell their positions (liquidation) to exit the market. When they close their positions, the derivatives open interest decreases. This is a sign that leverage is being wiped out of the system.
4. Can I use derivatives open interest for stock trading? Yes, specifically for options and futures. Stock traders often look at the derivatives open interest on call and put options (Max Pain theory) to see where market makers might try to pin the price at expiration.
5. Is rising price with falling derivatives open interest bullish? Actually, it is often bearish or neutral. If price is rising but derivatives open interest is falling, it means the rally is being driven by “Short Covering” (shorts exiting) rather than “New Buying.” Once the shorts are done exiting, there may be no new buyers left to push the price higher, leading to a reversal.